
Hey. Did you know that audiences forget 90 percent of what's presented to them? Well, of course you did! You've sat through your fair share of screamingly dull presentations where you felt proud that you remembered even 1.7 percent of what was presented (well, at least the parts you were awake for).
Good job, you! … Only, this time YOU'RE the one presenting!
So — given your teeny amount of available time and your equally tiny budget — here are seven easy-to-implement recommendations that will help your audience retain that 10 percent and keep them from sleeping while you speak.
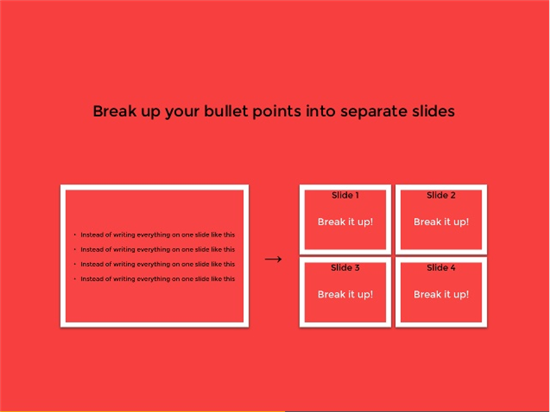
1. Include Only One Key Point per Slide
Yup, one. Here's why: Slides with too much verbiage will decrease the interest of your audience.
List ye ol' bullet points on separate slides like Damon Nofar does here:
2. Pay Attention to the 3-Second Rule!
… This one's not about food dropped on the ground and whether it's still edible. THIS is the 3-second rule that applies to how long it takes the audience to process your message.
According to graphic designer and knower-of-all-things-presentation-related Nancy Duarte, you should look at your slides and determine: "Will the audience understand what I'm trying to communicate in 3 seconds?"
No? Then whittle it down.
3. Have a Bold Opening Slide to Get the Audience's Interest Early
Check out these examples of great presentations.
This next one should be obvious, but:
4. Pick an Easy-to-Read Font
This means nothing smaller than 24 pt.
When in doubt (if you're not a font aficionado), Arial and other simple fonts are solid choices.
5. Create a Coherent Look and Feel
Every slide should feel like it's part of the same story (no one wants a left-out slide!).
To do this, you'll want to use the same or related fonts, colors, and imagery across all your slides.
Here's one of my absolute favorite-of-all-time slideshows that does this effectively: it's called You Suck at PowerPoint.

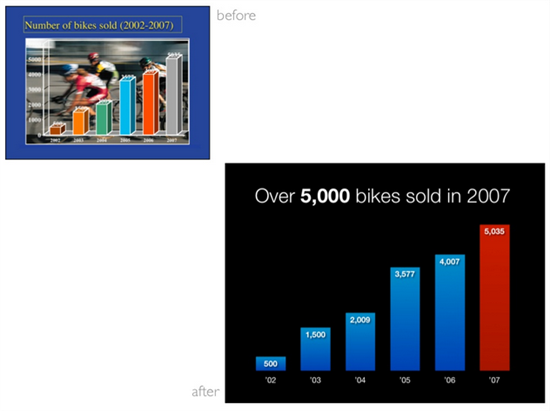
6. Slides with Data in Them Should Focus on the Meaning of the Data, not Just the Data
This means:
- Cluttered data slides are not useful
- Show only data that helps illustrate your point
- Display it in a way so that everyone can absorb it
Here's a prime example from presentation rockstar Garr Reynolds of how simplifying the dataset you want to share can be visually effective:
7. Use Images to Visualize and Explain
Images make content 55 percent more memorable than words (or so says the author of this presentation). Well-utilized images can enhance and reinforce your messages like they do in this example.
Importantly, do not use images just to decorate. This is distracting.
How to Get the Presentation Tools You Need
Microsoft PowerPoint and all the other Microsoft Office tools you need are available through Microsoft's TechSoup donation program.

[Editor's note: This post was updated in 2016.]
Image 1: Damon Nofar
Image 2: Jesse Desjardins
Image 3: Garr Reynolds