
As a part of the grantseeking community, you know how important it is to stay on top of giving trends. The State of Grantseeking Survey spotlights recent developments in funding so that organizations can be more strategic in their grantseeking.
The resulting free reports, published twice yearly in May and November, are valuable benchmarks for organizations to review their grantseeking efforts.

The State of Grantseeking Report can tell you what is a reasonable level of funding to expect for an organization based on median awards by organizational budget, location, and mission. It can also give you a leg up on the competition through early awareness of trends. Below are some of the data tools the The Fall 2017 State of Grantseeking™ Report provided. Feel free to use them to ensure that your grantseeking is guided to success.
Application Rates
Survey participants are an extremely active bunch of grantseekers! In fact, 86 percent of respondents applied for at least one award. Of those who applied, 81 percent won an award. More applications will result in greater award ratios, as you can see in the chart.
| Number of Applications | |||||||
|---|---|---|---|---|---|---|---|
| Number of Awards |
1 | 2 | 3 – 5 | 6 – 10 | 11 – 20 | 21 – 30 | 31+ |
| None | 46 | 69 | 76 | 12 | 8 | 1 | 3 |
| 1 | 74 | 72 | 97 | 23 | 8 | 1 | 0 |
| 2 | 10 | 93 | 182 | 46 | 11 | 4 | 4 |
| 3 – 5 | 4 | 11 | 285 | 215 | 68 | 11 | 5 |
| 6 – 10 | 1 | 0 | 13 | 124 | 156 | 35 | 18 |
| 11 – 20 | 0 | 0 | 0 | 8 | 80 | 74 | 56 |
| 21 – 30 | 0 | 0 | 0 | 0 | 6 | 25 | 32 |
| 31+ | 0 | 0 | 0 | 0 | 3 | 2 | 111 |
I recently spoke with a grantseeker whose goal is to submit one application per week. He decided to target corporations, despite knowing that the award size would not be large. But with a mission to eradicate local hunger, he felt that there were many manufacturers and distributors who would support his cause. His hunch proved to be correct, and his strategy is working.
Funding Forms
What form does funding usually take? The survey results can help guide your expectations when requesting funding. It is no surprise that project and program support was most frequently reported, by 44 percent of respondents. General support was the second most frequently reported support type, at 18 percent. I think that it bears noting that 82 percent of support types reported were not general operating funds — which are the most desired award type.
Funder Type and Award Size by Annual Budget, Mission, and More
Based on years of biannual report analysis, I find that (in order of importance) annual budget, mission focus, and service area have the most impact on an organization's grantseeking experience. However, organizational age and U.S. region can also skew grantseeking techniques and results.
The State of Grantseeking Report by Budget Size may be useful to you. That's because the grantseeking experiences of an all-volunteer organization with a $50,000 budget are very different from an organization with a $5 million budget. In addition, with capacity building and fundraising, you can exert a level of control over your budget. And, data by budget size is of value to all respondents.
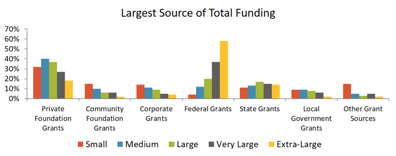
First, look at the funder types most likely to support your organization, based on the source of the largest individual award.
Now, look at the sizes of the median largest award. This will give you an idea of reasonable award goals and help you to manage your stakeholder expectations.
| Small | |||
|---|---|---|---|
| LARGEST AWARD SIZE | FALL 2017 | SPRING 2017 | FALL 2016 |
| Lowest $ | $250 | $100 | $250 |
| Highest $ | $7 million | $200,000 | $500,000 |
| Median $ | $8,000 | $5,000 | $5,175 |
| Average $ | $82,975 | $16,100 | $15,535 |
| MEDIUM | |||
|---|---|---|---|
| LARGEST AWARD SIZE | FALL 2017 | SPRING 2017 | FALL 2016 |
| Lowest $ | $250 | $500 | $40 |
| Highest $ | $4.8 million | $5 million | $3 million |
| Median $ | $25,000 | $25,000 | $25,000 |
| Average $ | $86,375 | $73,000 | $67,450 |
| LARGE | |||
|---|---|---|---|
| LARGEST AWARD SIZE | FALL 2017 | SPRING 2017 | FALL 2016 |
| Lowest $ | $500 | $125 | $500 |
| Highest $ | $14.5 million | $8 million | $15 million |
| Median $ | $100,000 | $100,000 | $100,000 |
| Average $ | $350,425 | $290,775 | $765,575 |
| VERY LARGE | |||
|---|---|---|---|
| LARGEST AWARD SIZE | FALL 2017 | SPRING 2017 | FALL 2016 |
| Lowest $ | $550 | $600 | $100 |
| Highest $ | $14 million | $36 million | $150 million |
| Median $ | $300,000 | $150,000 | $250,000 |
| Average $ | $1,072,550 | $1,044,150 | $2,242,200 |
| EXTRA LARGE | |||
|---|---|---|---|
| LARGEST AWARD SIZE | FALL 2017 | SPRING 2017 | FALL 2016 |
| Lowest $ | $3,900 | $100 | $8,200 |
| Highest $ | $150 million | $186 million | $92 million |
| Median $ | $800,000 | $426,000 | $553,250 |
| Average $ | $4,929,500 | $3,388,725 | $2,645,475 |
Knowing what type of grantmaker funds other organizations like yours — and at what levels — can help you in choosing where to devote your energies.
Funding also varies widely by mission focus. Although your mission is your passion, not all missions receive similar awards — so having a side-by-side comparison with other, similar organizations is key.
For example, animal-related organizations more frequently reported that their largest award came from private foundations (58 percent) than did other organizations, but they reported federal funding at only 2 percent. Compare these results to community improvement organizations, which reported at 23 percent for private foundations and 22 percent for federal awards, and you can see the value of knowing the largest individual award source by mission focus.
Also keep in mind that success is relative: for a small animal rescue, a $25,000 grant is impressive, based on the median highest award of $10,000. But a community improvement group receiving a $25,000 may not consider this a success, because the median highest award for this type of organization is $75,000.
You can see how this type of fresh, recent information can assist you in fine-tuning your grants management strategies. But the information is only available if sufficient organizations participate in the survey. Last fall, over 4,000 organizations found value in the reports and invested their time in survey participation. And as a result, we were able to add new mission focus categories and international statistics.
The resulting free reports are available here, and you can take part in the Spring State of Grantseeking™ Survey here.