For the Professional Social Media class I teach at Sonoma State University, I created an exercise designed to help folks practice both content creation and looking at metrics. Nonprofits can use this at a staff meeting or other gathering to help people improve their content creation skills as well as their skills with looking at social media data.
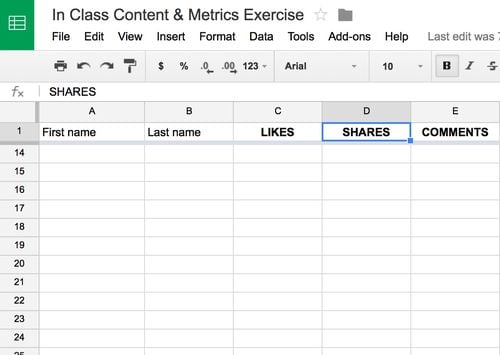
The equipment is mostly analog: the index cards and colored dots pictured below, plus a place to record the results. To view the results, I use a shared Google spreadsheet, but you could make a grid on a whiteboard or even just a piece of paper.

Here's how it works,
1. Stage Setting
Brief everyone on what is going to happen. Each person will be given an index card and enough dots for the number of folks participating. I ask folks to not write their name on the card, but see below for options.
2. Content Creation
On the card, write a short (preferably one sentence) social media update. In my case, I use a Facebook update, but you could use an update on any channel with the relevant engagement options, in this case Like, Comment, and Share. Ask folks to think about the people in the group and what content would appeal to them.
3. Engagement
The cards are collected and mixed up, and then each person is given one card. Using the dots, they will indicate if they would "Like" (blue), "Share" (yellow), or "Comment" (green) on the post. Each person reads a card and attaches any stickers that indicate how they would respond if they saw the post online. The card is then passed to the next person until everyone has "voted." I ask folks to put the stickers on the back of the card.
4. Metrics

The totals are then tallied. You could collect them all and write on a piece of paper or whiteboard what each person's totals were for each of the possible actions. In my case, I will ask folks to take back their card and type their scores into the online document, which we will view live. One advantage of using an online spreadsheet is that once the data is in, I am able to easily sort the columns to see who had the most of each type of engagement.
5. Debrief
We review which updates got the most and the least engagement, and I ask folks to suggest why they think something worked or not. You might have a token prize for winners if you choose; I don't because I want to reward learning, not just success.
This exercise helps people to see in real time how much engagement their example post gets. It also helps them see what worked — or didn't — for others, and helps to spark a conversation about the shared characteristics of the posts that elicit engagement. Participants are wonderfully creative in the ways they try to tap into the interests of their audience.
You could also do this anonymously using numbers on the cards if, for, example you are doing this with folks who are strangers. You could also have folks include their names, as the credibility of the source can affect engagement. For my cohort, I prefer the anonymous route to reduce bias. The other influencer can be that as a card is passed around that has a lot of engagement (stickers), that could either spur or deter folks. But that is the same online.
I like how the exercise shows that some posts are better if sharing is the main goal, while other posts (especially questions) are better at sparking conversation and generating comments. If some get a lot of likes but little sharing and comments, why is that? Although I think getting just "likes" is not a great metric, it's better than no interaction at all. This exercise helps point out how the different types of posts are received.
Feel free to remix, modify, and share this exercise. Beyond social media, this could also be interesting to use for donation appeals, event messaging, or any other messages your nonprofit is sending out.
About the Author
John Kenyon is a leading authority on nonprofit technology and communications. He is an educator and consultant who's worked exclusively with nonprofits for over 25 years providing advice, teaching seminars, and writing articles. John is an adjunct professor at the University of San Francisco and Sonoma State University. He has been a featured speaker across the United States, England, Australia, and online.
This blog post was originally published on John Kenyon's blog.
Images 2 and 3: John Kenyon


